
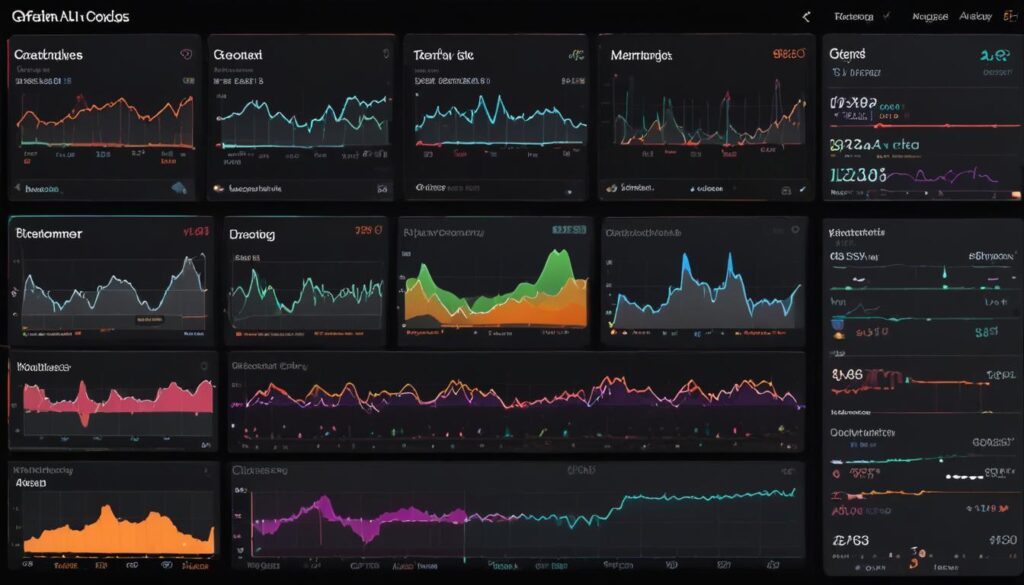
In today’s dynamic cloud-native ecosystems, siloed monitoring tools create blind spots that hinder incident resolution. A unified observability strategy bridges tracing, metrics, and logs to provide a holistic view of application behavior. This reduces mean-time-to-detect (MTTD) incidents by up to 60% according to industry benchmarks, while eliminating the complexity of managing disjointed systems. By correlating trace IDs across logs and metrics, teams can pinpoint root causes in moments rather than hours.
Core Concepts and Standards
The foundation of unified observability lies in open standards like OpenTelemetry for instrumentation, OpenMetrics for metric consistency, and Elastic Common Schema (ECS) for structured logging. These frameworks ensure interoperability between diverse tools. For instance, OpenTelemetry automatically captures spans for distributed tracing, while OpenMetrics enables seamless integration with Prometheus. Adopting these standards future-proofs your observability pipeline against vendor lock-in and technical debt.
- OpenTelemetry: Standardized instrumentation across languages
- OpenMetrics: Universal format for metrics aggregation
- ECS: Structured logging schema for cloud-native tools
- Grafana Tempo: High-performance tracing backend
- Loki: Scalable log aggregation system
Instrumentation Across Tech Stacks
Implementing observability requires tailored approaches for each language. In a Node.js service, auto-instrumentation via OpenTelemetry SDK captures HTTP requests and custom metrics. A Go microservice might use OTLP exporters for direct Prometheus integration. Python workers can leverage logging libraries to tag logs with trace IDs. Each implementation must balance granularity with performance, ensuring sampling rates don’t exceed 10% for high-volume services.
- Node.js: OTLP exporter for distributed tracing
- Go: Direct Prometheus exporter with HTTP metrics
- Python: Logging middleware with ECS formatting
- Auto-instrumentation: Agent-based trace capture
- Custom metrics: Prometheus node exporters
Effective correlation requires consistent tracing IDs across all data sources. For example, a trace ID in logs should match the span context in metrics. Queries in Loki might use logstash-like patterns to filter by trace ID, while PromQL could aggregate metrics per service. Alerting rules should trigger when metric anomalies correlate with log spikes for the same trace.
Performance and Cost Optimization
Unified systems must optimize storage and processing. Implement retention policies for logs (e.g., 30 days) and delete old traces. Sampling rates should adjust dynamically based on cluster load. Dashboards should prioritize critical paths using percentile-based metrics. Cost metrics like cost-per-million spans help teams balance reliability with budget constraints.
- Sampling rates: 1% for business-critical services
- Retention policies: Tiered storage for logs and traces
- Cost metrics: Track span storage vs. query latency
- Performance QPS: Maintain under 500 requests/second
- Alert cooling: Rate-limit notifications to avoid alert fatigue
Real-world case studies validate this approach. A migration from a monolith to Kubernetes-based microservices reduced MTTD from 4 hours to 12 minutes. Teams reported 70% fewer false positives by leveraging trace context. The checklist includes validating OTel agent compatibility, testing log correlation with sample data, and benchmarking dashboard refresh rates against user expectations.