
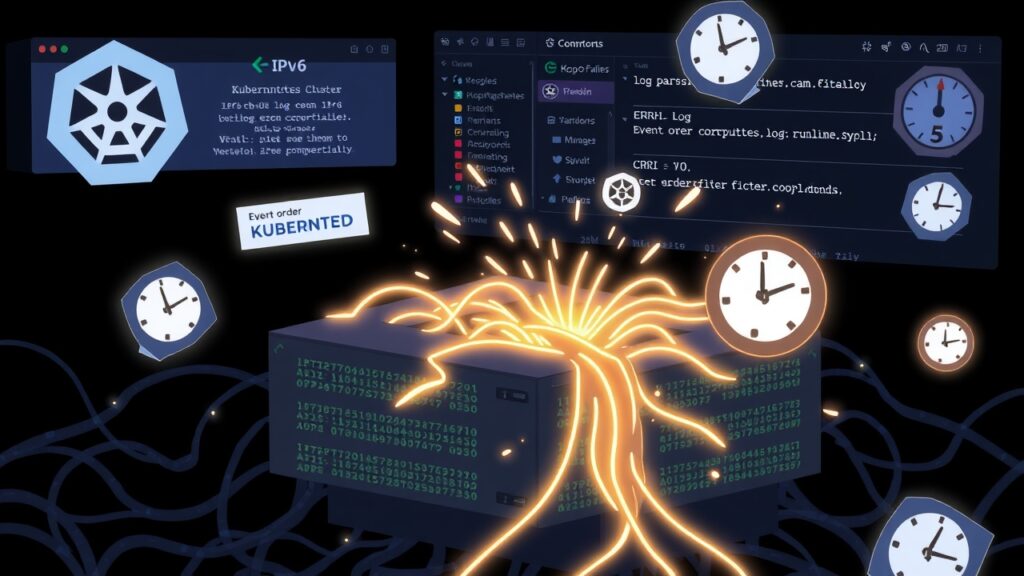
Kubernetes clusters power some of the world’s most demanding applications, but when it comes to logging, the complexity of distributed systems often leads to silent failures that disrupt observability. Unlike traditional monolithic applications, Kubernetes environments generate logs from hundreds or thousands of pods, each with unique IP addresses, container runtimes, and multiline structures. These factors create hidden traps in your logging pipeline that can corrupt log parsing, delay alerts, and even mask critical incidents.
- How IPv6 addresses confuse log parsers expecting IPv4 formats
- Why CRI-O runtime breaks multiline stack traces and how to fix it
- The hidden danger of timestamp skew across nodes and pods
- Buffer overflows in log forwarders and their impact on event integrity
- How default Kubernetes logging drivers misroute or drop log lines
Why Kubernetes Logging is Different from Traditional Systems
In traditional server environments, logs are typically generated by a single application on a known host with a stable IP and predictable timestamp. Kubernetes, however, introduces dynamic networking, ephemeral containers, and multiple container runtimes like CRI-O and containerd. Each pod can have a different IP version (IPv4 vs. IPv6), and log lines may span multiple events due to multiline stack traces. These factors force your logging pipeline to handle variability it was never designed for.
Pitfall 1: IPv6 Pod Addresses Breaking Log Parsers
Most log parsing tools and regex patterns assume IPv4 addresses (e.g., 192.168.1.100). In Kubernetes clusters using IPv6, pod IPs look like 2001:db8:1:2::100, which contain colons and hexadecimal characters that crash standard IP extraction patterns. If your log aggregator uses a regex like `\d+\.\d+\.\d+\.\d+` to extract client IPs, it will silently fail to match IPv6 addresses, leading to missing or mislabeled log sources.
- Use regex patterns that support both IPv4 and IPv6: `((?:[0-9]{1,3}\.){3}[0-9]{1,3}|([0-9a-fA-F]{1,4}:){7}[0-9a-fA-F]{1,4})`
- Enable dual-stack networking in your cluster to avoid surprises
- Test your log parser against a sample of real pod IPs before deployment
- Use structured logging (JSON) to avoid IP parsing altogether
Pitfall 2: CRI-O Multiline Stack Traces Disrupting Log Flow
CRI-O, a lightweight container runtime, handles multiline output differently than Docker. While Docker treats multiline logs as a single entry, CRI-O splits them into multiple log lines. This breaks parsers expecting a single stack trace per log event. For example, a Java exception with 10 lines becomes 10 separate log entries, each with its own timestamp and metadata, causing your log aggregator to misinterpret event boundaries.
- Configure CRI-O to use JSON logging format for better structure
- Use Fluent Bit or Fluentd plugins that support CRI-O multiline parsing
- Apply regex patterns to merge log lines before parsing: `(?m)^(?:\s*\S+.*|\s*\s+at\s+.*)`
- Enable `multiline` mode in your log forwarder with a clear start pattern (e.g., stack trace header)
Pitfall 3: Timestamp Skew Across Nodes and Pods
Kubernetes nodes may not be time-synchronized, especially in hybrid or multi-region clusters. If Pod A on Node 1 reports a log timestamp of 10:00:00 UTC and Pod B on Node 2 reports 10:00:15 UTC due to NTP misconfiguration, your log aggregator will process events out of order. This breaks alerting logic that assumes chronological ordering and can mask race conditions or cascading failures.
- Synchronize all nodes with a reliable NTP service (e.g., chrony or ntpd)
- Use UTC timestamps across the cluster to avoid timezone confusion
- Enable timestamp validation in your log forwarder (e.g., Fluent Bit’s `time` field)
- Consider using a centralized time source like Prometheus or Grafana Loki for ordering
Pitfall 4: Buffer Overflows in Log Forwarders
Log forwarders like Fluentd and Fluent Bit have limited buffer sizes. During traffic spikes or when a downstream service is slow, logs can pile up in memory or disk buffers. If the buffer overflows, older log entries may be dropped or corrupted, leading to gaps in your event history. This is especially common when using the Kubernetes API to tail pod logs directly.
- Increase buffer size and chunk limits in your forwarder config: `buffer_chunk_limit 1M` and `buffer_queue_limit 1024`
- Use persistent queues (disk-based) for high-volume clusters
- Monitor buffer usage metrics to detect overflow risks
- Consider using sidecar log collectors to reduce per-pod API calls
Pitfall 5: Default Logging Drivers Misroute or Drop Logs
Kubernetes defaults to the `json-file` logging driver, which can discard logs under pressure or fail to rotate files properly. In resource-constrained environments, the container runtime may stop writing logs or truncate them, leading to silent data loss. Additionally, the `json-file` driver does not handle multiline logs well without additional configuration.
- Switch to a more robust logging driver like `journald` or `local` for better reliability
- Enable log rotation and retention policies: `max-size=100m`, `max-file=5`
- Use a dedicated logging sidecar (e.g., Fluent Bit) to bypass driver limitations
- Monitor disk usage and log rotation events
How to Build a Reliable Kubernetes Logging Pipeline
To avoid these pitfalls, adopt a structured, battle-tested logging pipeline. Start by centralizing logs using a dedicated forwarder like Fluent Bit, which supports CRI-O multiline parsing, dual-stack IP handling, and buffer management. Then, use a log aggregator like Loki, Elasticsearch, or Splunk to store and query logs efficiently. Finally, enforce consistency with standardized logging formats (e.g., JSON) and validate your pipeline with real-world traffic before going to production.
- Use Fluent Bit as a log forwarder with CRI-O multiline support enabled
- Deploy Loki for scalable, cost-effective log storage and querying
- Implement structured logging in your applications (e.g., JSON with severity, service, and trace IDs)
- Set up alerts for log parsing failures, buffer overflows, and timestamp anomalies
- Regularly audit your logging pipeline with synthetic log generators
Advanced Debugging Techniques for Log Failures
When logs go missing or parsing fails, use these techniques to debug: capture raw logs from the pod filesystem (`/var/log/containers/`), replay them through your parser to identify failures, and compare structured output with your aggregator’s interpretation. Tools like `kubectl logs –previous` and `journalctl` can help retrieve logs even from terminated pods. For multiline issues, enable debug logging in your container runtime or forwarder to trace how logs are processed.
- Inspect raw logs directly from the node using `cat /var/log/containers/*`
- Use `kubectl logs -p` to fetch logs from previous instances of a container
- Enable debug mode in Fluent Bit (`-d`) to trace log processing
- Compare raw vs. parsed logs to identify where parsing fails
- Test regex patterns in isolation before deploying to production
Conclusion: Turn Logging Pitfalls into Observability Strengths
Silent log parsing failures in Kubernetes can erode trust in your monitoring and alerting systems. By understanding the hidden pitfalls—IPv6 confusion, CRI-O multiline quirks, timestamp skew, buffer overflows, and driver limitations—you can design a logging pipeline that is resilient, scalable, and reliable. Implement structured logging, validate parsers against real-world data, and monitor your pipeline proactively. With the right setup, your logs will not only reflect reality but also empower faster debugging, stronger alerts, and deeper insights into your distributed systems.